


Satellite imagery shows a wastewater pond below North Korea’s Pyongsan uranium plant repeatedly expanding and shrinking between February and September 2026. The fluctuations keep alive concerns that toxic runoff from the plant could reach the nearby Ryesong River. After an earlier review of optical imagery, I used radar data to track changes in the pond’s water surface over time.
Data from the European Space Agency’s Sentinel-1 satellite show the pond covered about 0.79 hectares on Feb. 25. It grew to a peak of 1.38 hectares in mid-April before measuring 0.85 hectares on Sept. 24. Sentinel-1 carries synthetic aperture radar (SAR), which can image the ground day or night and through thick cloud. These shifts offer fresh evidence of how North Korea handles wastewater at a key site in its nuclear weapons program. Further verification is still needed, however, to determine what caused the changes and whether pollutants are actually entering the river.
The Pyongsan uranium plant in North Hwanghae province is one of North Korea’s main facilities tied to nuclear material production. It treats uranium ore with sulfuric acid and other chemicals to produce uranium concentrate, commonly known as yellowcake. Yellowcake is the raw material that is later converted and enriched into fuel for reactors or nuclear weapons. The process leaves behind acidic wastewater and sludge that can contain heavy metals and other hazardous substances. The Ryesong River flows south into the Han River estuary near the inter-Korean border. That proximity has prompted South Korean authorities to test nearby waters for radioactive contamination in the past.
Recent imagery from Planet Labs reveals how wastewater moves through the site. Planet Labs is a U.S. commercial satellite company that photographs nearly the entire globe every day. In a false-color band combination that highlights water, the river and the plant’s ponds all appear in black. The largest of these is a tailings pond, a holding basin for the liquid and solid waste left over from ore processing. It covers about 34.9 hectares, including some 16.0 hectares (45.8%) of what appears to be solid sludge. That sludge shows up in pink, matching the color of the surrounding land.
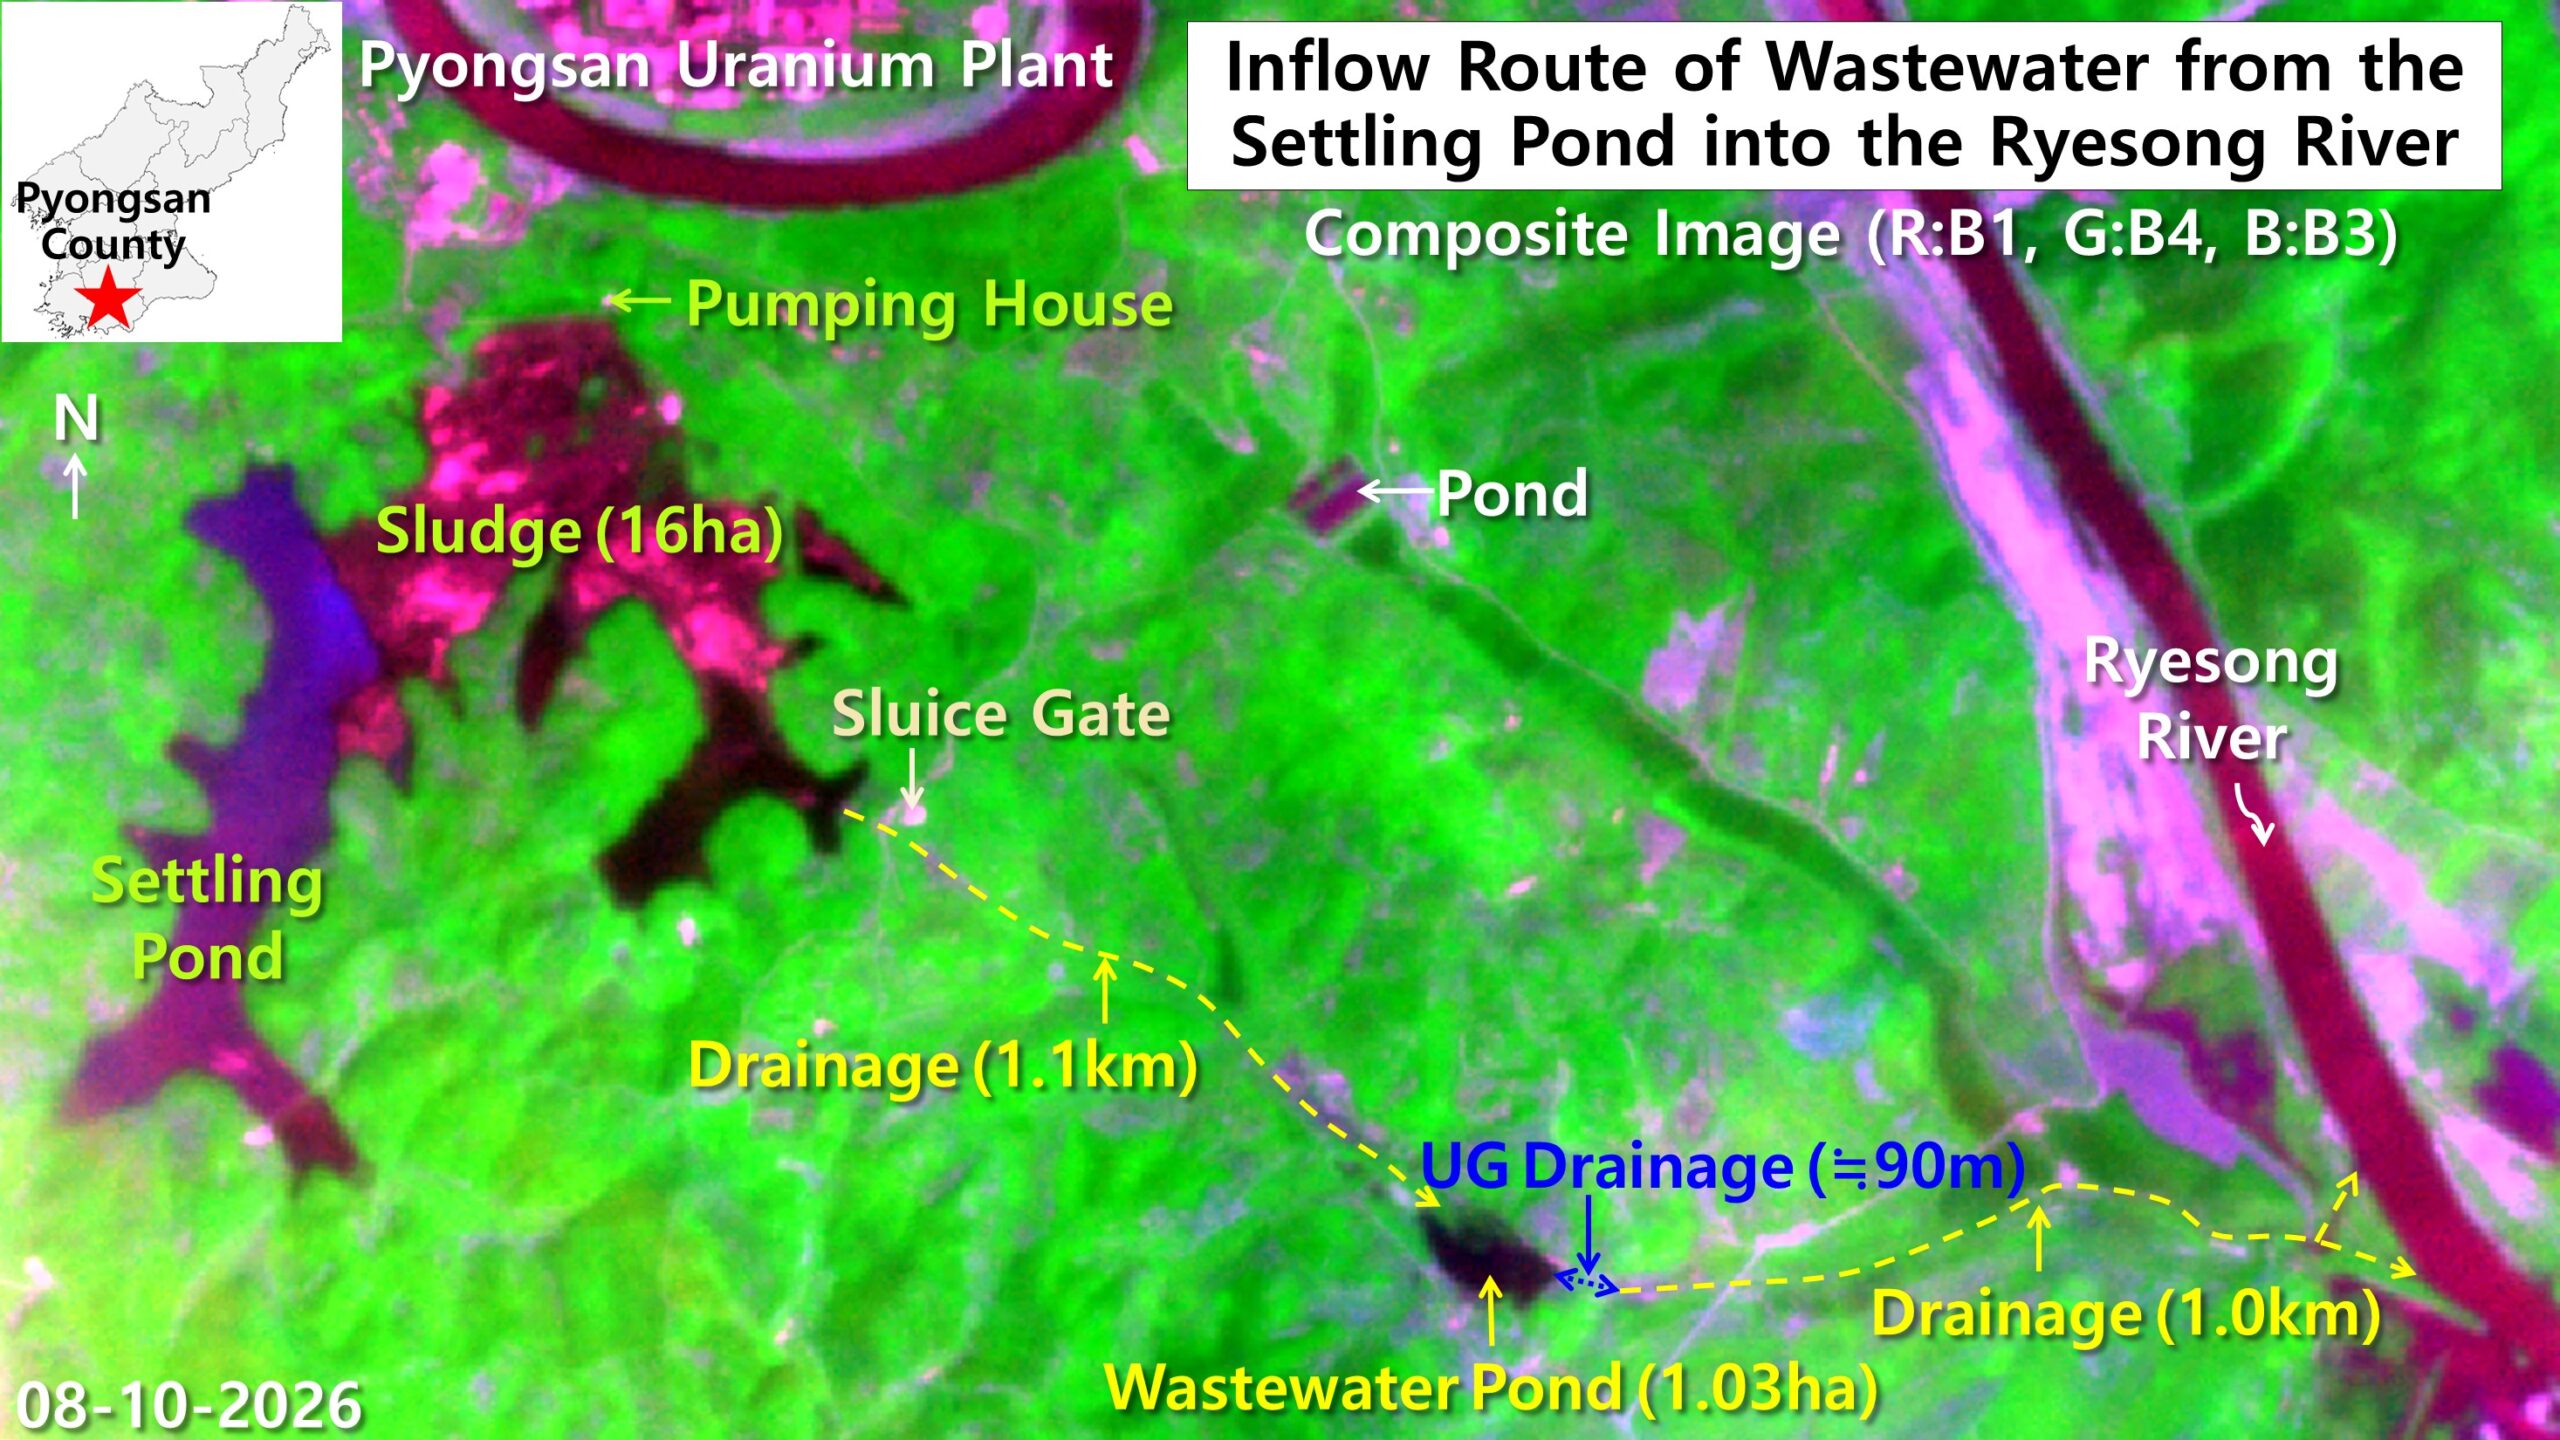
Water apparently released through the tailings pond’s sluice gate runs about 1.1 kilometers down a drainage channel. On low ground downstream, it collects in a dark pond of about 1.03 hectares, roughly 1.4 times the size of a soccer field. The pond’s tone closely matches that of the tailings pond upstream, suggesting that material discharged from the plant has moved downstream. Imagery alone, however, cannot confirm whether the water contains heavy metals or radioactive substances.
From the pond, water appears to drain through a buried pipe about 90 meters long into a stream on the opposite side. That stream flows roughly another kilometer before joining the main channel of the Ryesong River. The satellite imagery therefore reveals a drainage route that could carry material from the tailings pond toward the river.
Radar tracks the Pyongsan uranium plant’s wastewater pond month by month
To follow this route regardless of weather or time of day, I applied a water index to Sentinel-1 radar data. The index combines two of the satellite’s polarization readings, known as VV and VH, at a resolution of 10 meters. Both readings measure how strongly radar signals bounce back from different kinds of surfaces. In the results, the river and both ponds appear in dark blue, while the dry land around them shows up in white. An image from Sept. 24 captures the downstream pond at about 0.85 hectares.
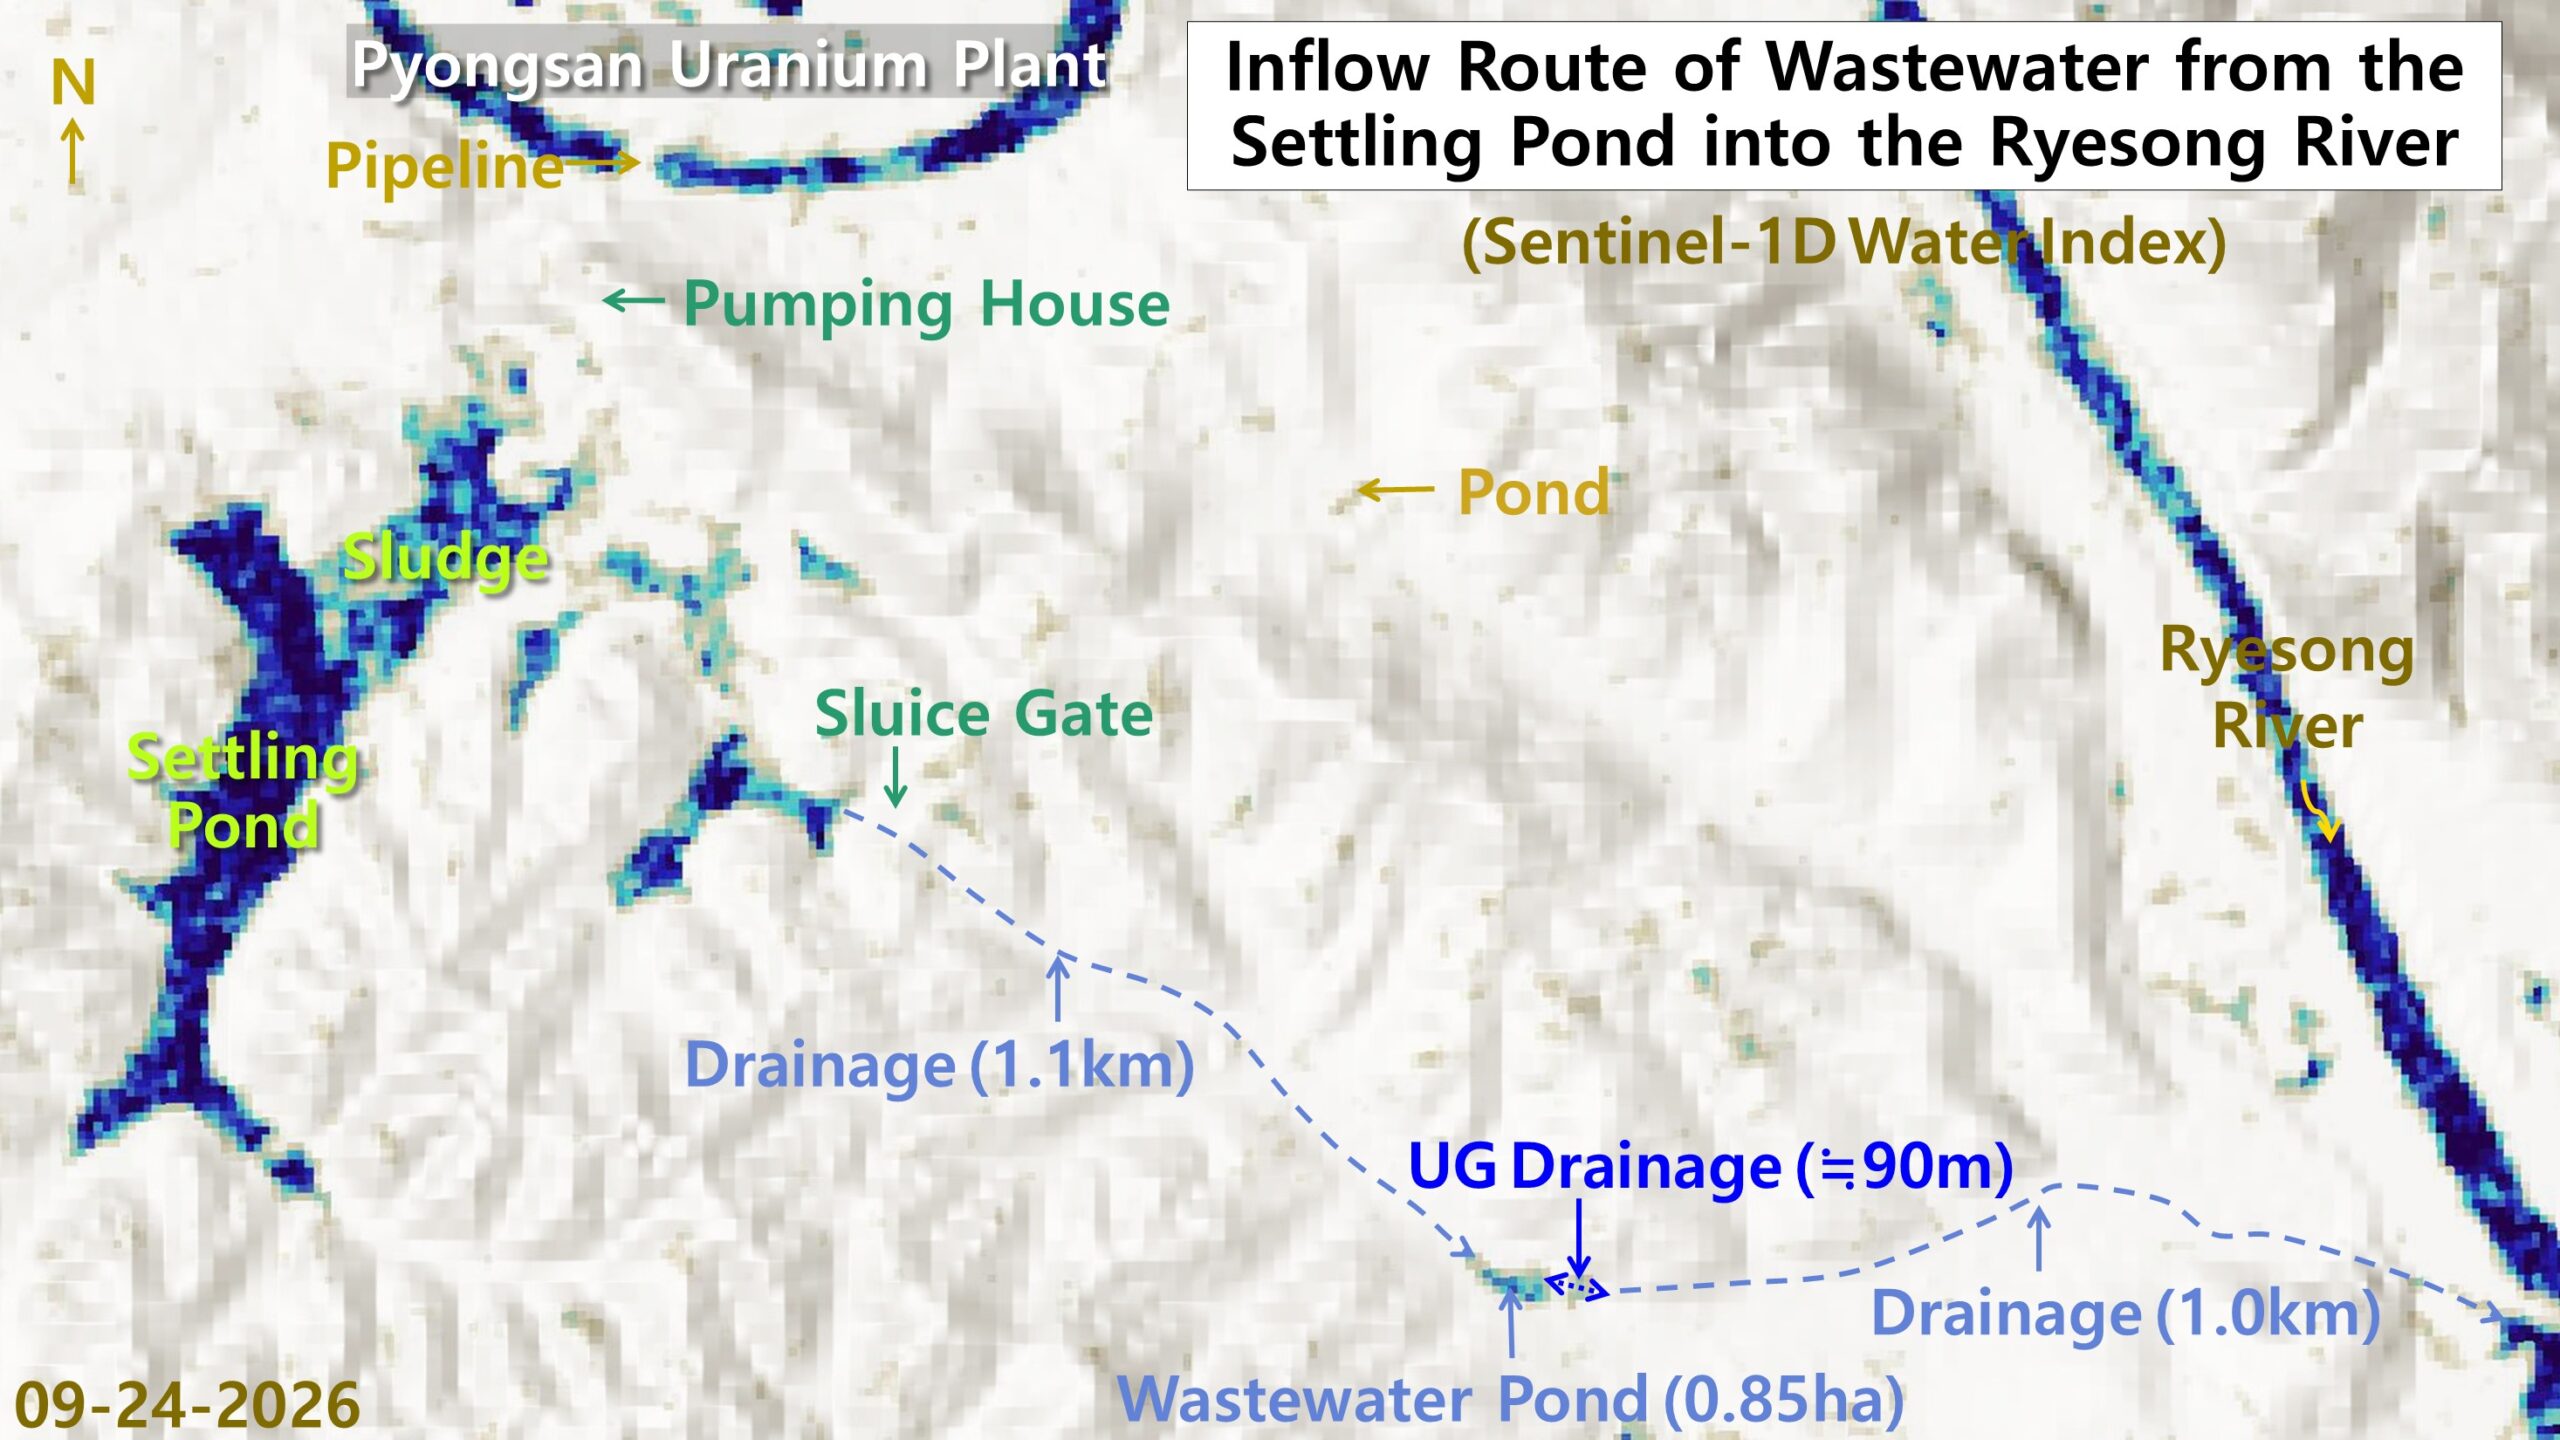
The downstream pond likely serves as a holding point where water released from the tailings pond collects before moving on. Water that pools there may then travel through the stream channel toward the main Ryesong River.
Tracking the Sentinel-1 data date by date shows how the pond’s size has shifted through the year. The pond first appeared at about 0.79 hectares on Feb. 25 and widened to between 0.97 and 1.26 hectares in March. It reached its largest extent in April, when readings ranged from 1.04 to 1.38 hectares. It then contracted somewhat in May (from 1.22 to 0.83 hectares), June (0.82 hectares) and July (0.80 hectares). Through August (0.86 hectares) and Sept. 24 (0.85 hectares), its area continued to rise and fall slightly.
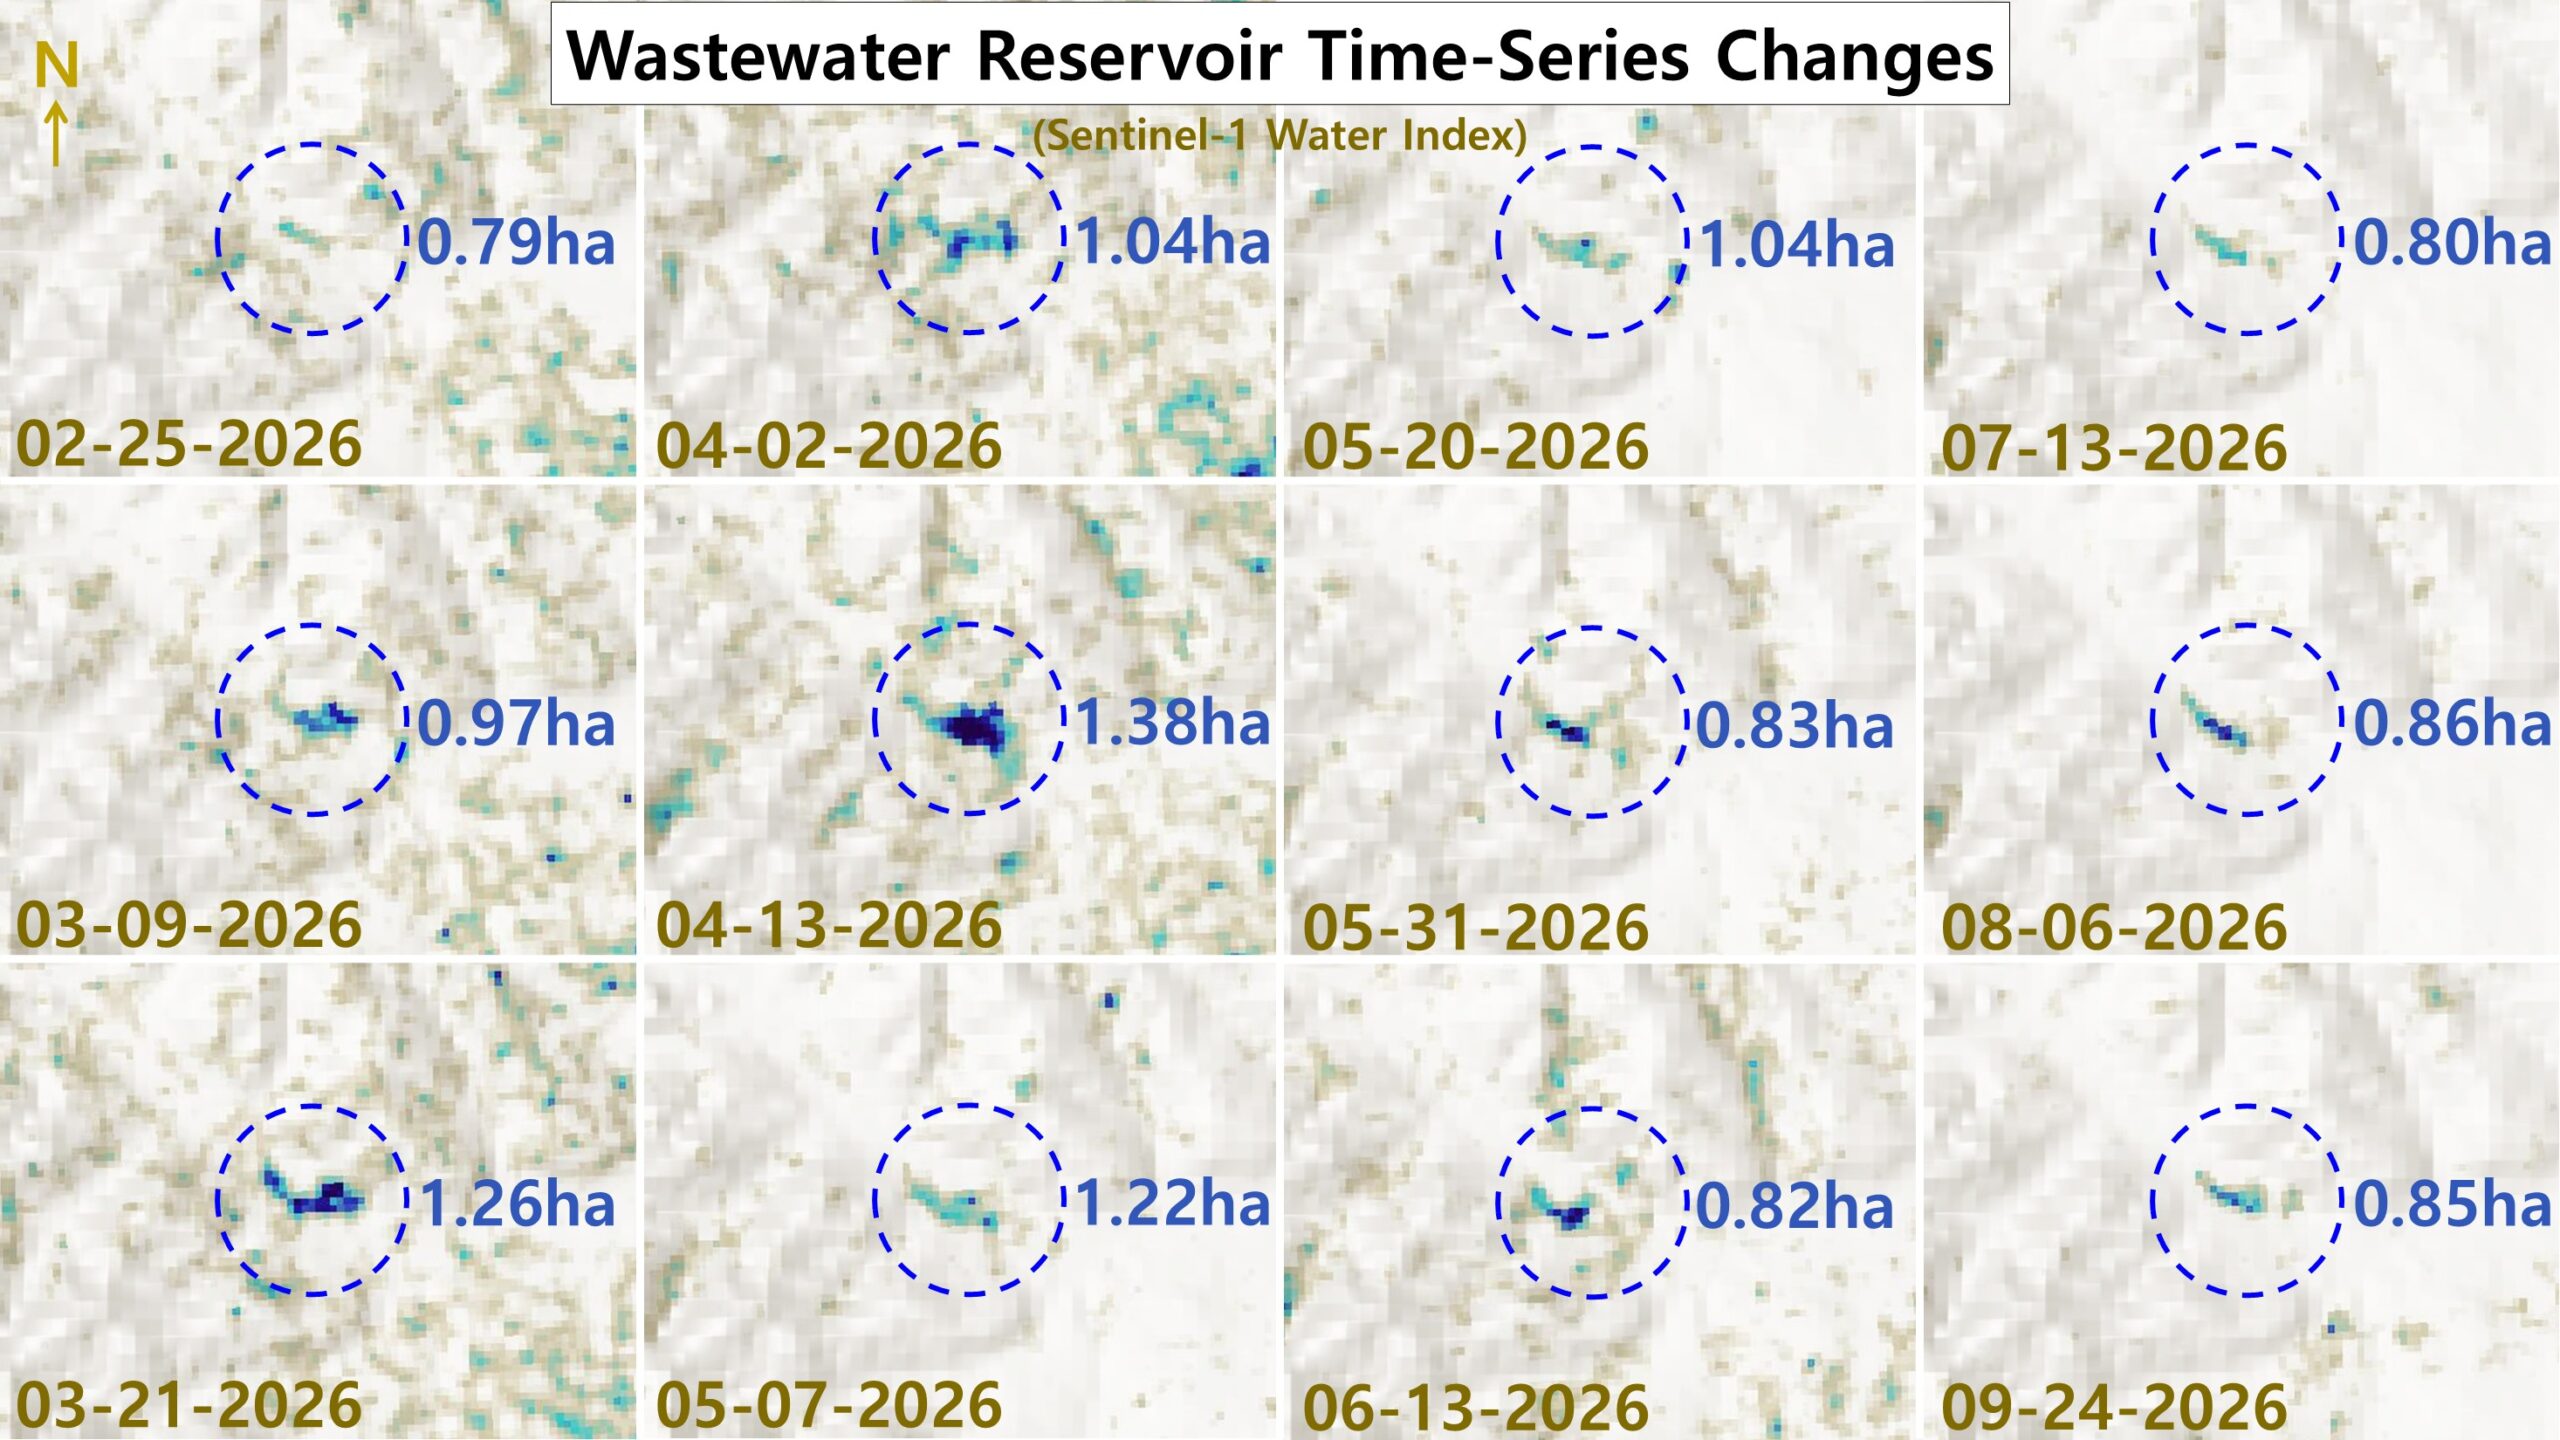
These repeated swings suggest changes in how much water the tailings pond released or in drainage conditions downstream. It remains unclear, however, whether the plant deliberately regulated discharges or whether rainfall and evaporation drove the changes.
Earlier satellite analyses have also pointed to ongoing operations at the Pyongsan uranium plant. In March 2023, 38 North pointed to rail car traffic and mounting waste in the tailings pond as signs of continued operation. 38 North is a Washington-based research program at the Stimson Center that analyzes North Korea, often using commercial satellite imagery. The shifting size of the downstream pond adds further evidence that drainage activity below the plant is continuing. These observations alone, however, cannot reveal how much yellowcake the plant currently produces or how intensively it operates. With Kim Jong Un pressing to expand North Korea’s nuclear arsenal, the site warrants close and continued monitoring.
October 19, 2026 at 08:13PM
by DailyNK(North Korean Media)